Content Marketing ROI Analyzer
Discover your content marketing ROI with our free analyzer! Input costs and revenue to see if your efforts are paying off. Try it now!
Analytics, dashboards, KPIs, ROI, measurement, attribution. The data side of growth.

Discover your content marketing ROI with our free analyzer! Input costs and revenue to see if your efforts are paying off. Try it now!
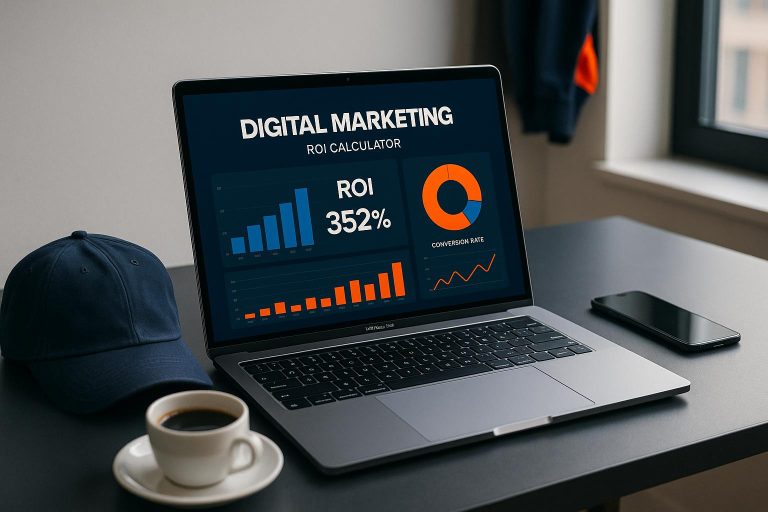
Calculate your digital marketing ROI instantly with our free tool. Input your spend and revenue to see if your campaigns are paying off!
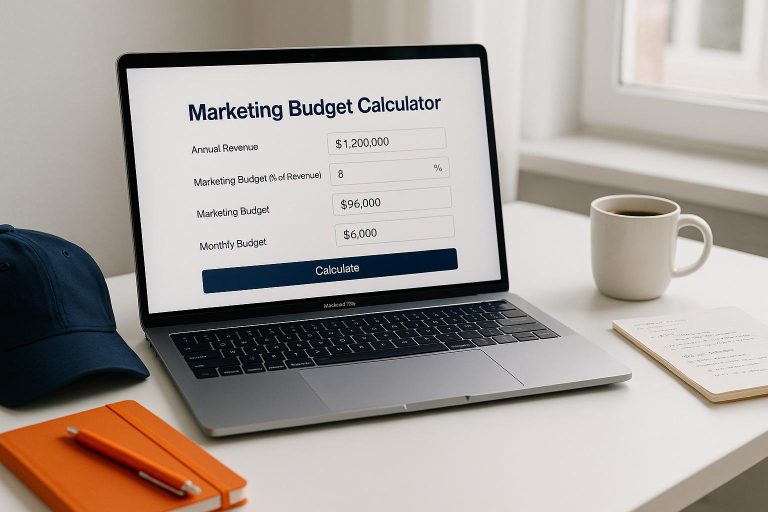
Plan your marketing spend with our free calculator! Easily allocate budgets to social media, ads, and more—perfect for small to medium businesses.

Explore how real-time predictive analytics enhances e-commerce through personalized recommendations, dynamic pricing, and improved customer retention.

Explore the top KPIs for AI-driven content personalization, essential for measuring success and enhancing customer engagement.

Explore 10 essential KPI templates to effectively track marketing goals and measure success across various channels and strategies.

Unlock the potential of your B2B content distribution by leveraging analytics to target audiences, optimize channels, and measure success.