AI dashboards simplify marketing analytics by consolidating data from 80+ platforms into one place, automating manual tasks, and delivering actionable insights through machine learning. They save time, improve decision-making, and help marketers optimize campaigns in real-time. Key features include:
- Automated Data Integration: Connects platforms like Google Ads, HubSpot, and Shopify, standardizing metrics for accuracy.
- AI-Driven Insights: Predicts trends, identifies underperforming campaigns, and answers queries using natural language.
- Customizable Reporting: Tailors dashboards to business needs with visualizations, white-label options, and automated sharing.
Top platforms include Whatagraph, AgencyAnalytics, Klipfolio, Databox, NinjaCat, and TapClicks. Each offers unique strengths, from integrations to advanced AI tools, catering to agencies, startups, and compliance-focused teams. Choosing the right platform depends on your data sources, AI needs, and scalability goals.
AI for Marketing Analytics: The Good, the Bad, and the Ugly
Key Features of AI-Powered Marketing Dashboards
AI-powered marketing dashboards stand apart from traditional analytics tools by offering a combination of automated data integration, machine learning insights, and flexible customization. These features simplify data access and enable faster, more informed decision-making. Let’s take a closer look at what makes these dashboards so effective.
Automated Data Integration Across Platforms
One of the biggest hurdles for marketing teams is pulling together data from platforms that use different formats and terminologies. AI dashboards solve this issue by automatically connecting to various data sources – ranging from advertising platforms like Google Ads and Facebook Ads to email services, CRMs, and ecommerce systems. They consolidate all this information into a single, unified view.
For instance, tools like Whatagraph support over 55 native integrations, while Klipfolio connects to more than 130 platforms. These dashboards also standardize inconsistent metrics – like aligning "link clicks" with "clicks" – through automated data normalization, making comparisons seamless and accurate.
Machine Learning for Insights and Predictions
Raw data only tells part of the story; machine learning takes it further by uncovering patterns and predicting future trends. AI-powered dashboards analyze multiple variables – such as campaign performance, audience behavior, and client outcomes – simultaneously. This helps marketers identify insights that manual analysis might overlook.
Another standout feature is natural language querying, which allows users to ask questions in plain English instead of relying on complex code. Advanced platforms even include tools like Ask AI or AI-powered recommendations, which help pinpoint underperforming campaigns or highlight emerging trends. By delivering real-time insights, these dashboards empower marketers to make quicker, more confident decisions.
Customizable Visualizations and Reporting
Every business has unique priorities when it comes to metrics. For example, an ecommerce brand might focus on profitability and inventory, while a SaaS company tracks user engagement and retention. AI dashboards cater to these needs by offering extensive customization options. Users can choose from a wide range of visualization types – Domo’s Analyzer feature alone provides over 150 chart options and 7,000+ custom maps.
For agencies, white-label features are particularly useful. Platforms like Whatagraph and AgencyAnalytics allow agencies to brand reports with their own identity. Additionally, template cloning simplifies the setup process by letting users duplicate pre-made dashboards for new clients. Reports can be shared in various formats, including live links, PDFs, or scheduled emails, making it easy to keep stakeholders informed.
Top AI-Powered Dashboard Platforms for Marketing Analytics
Picking the right dashboard platform can completely change how you approach marketing analytics. Each platform has its own set of strengths, from seamless integrations to cutting-edge AI insights. Here’s a closer look at six standout options and what makes them shine in the world of AI-driven marketing.
Whatagraph
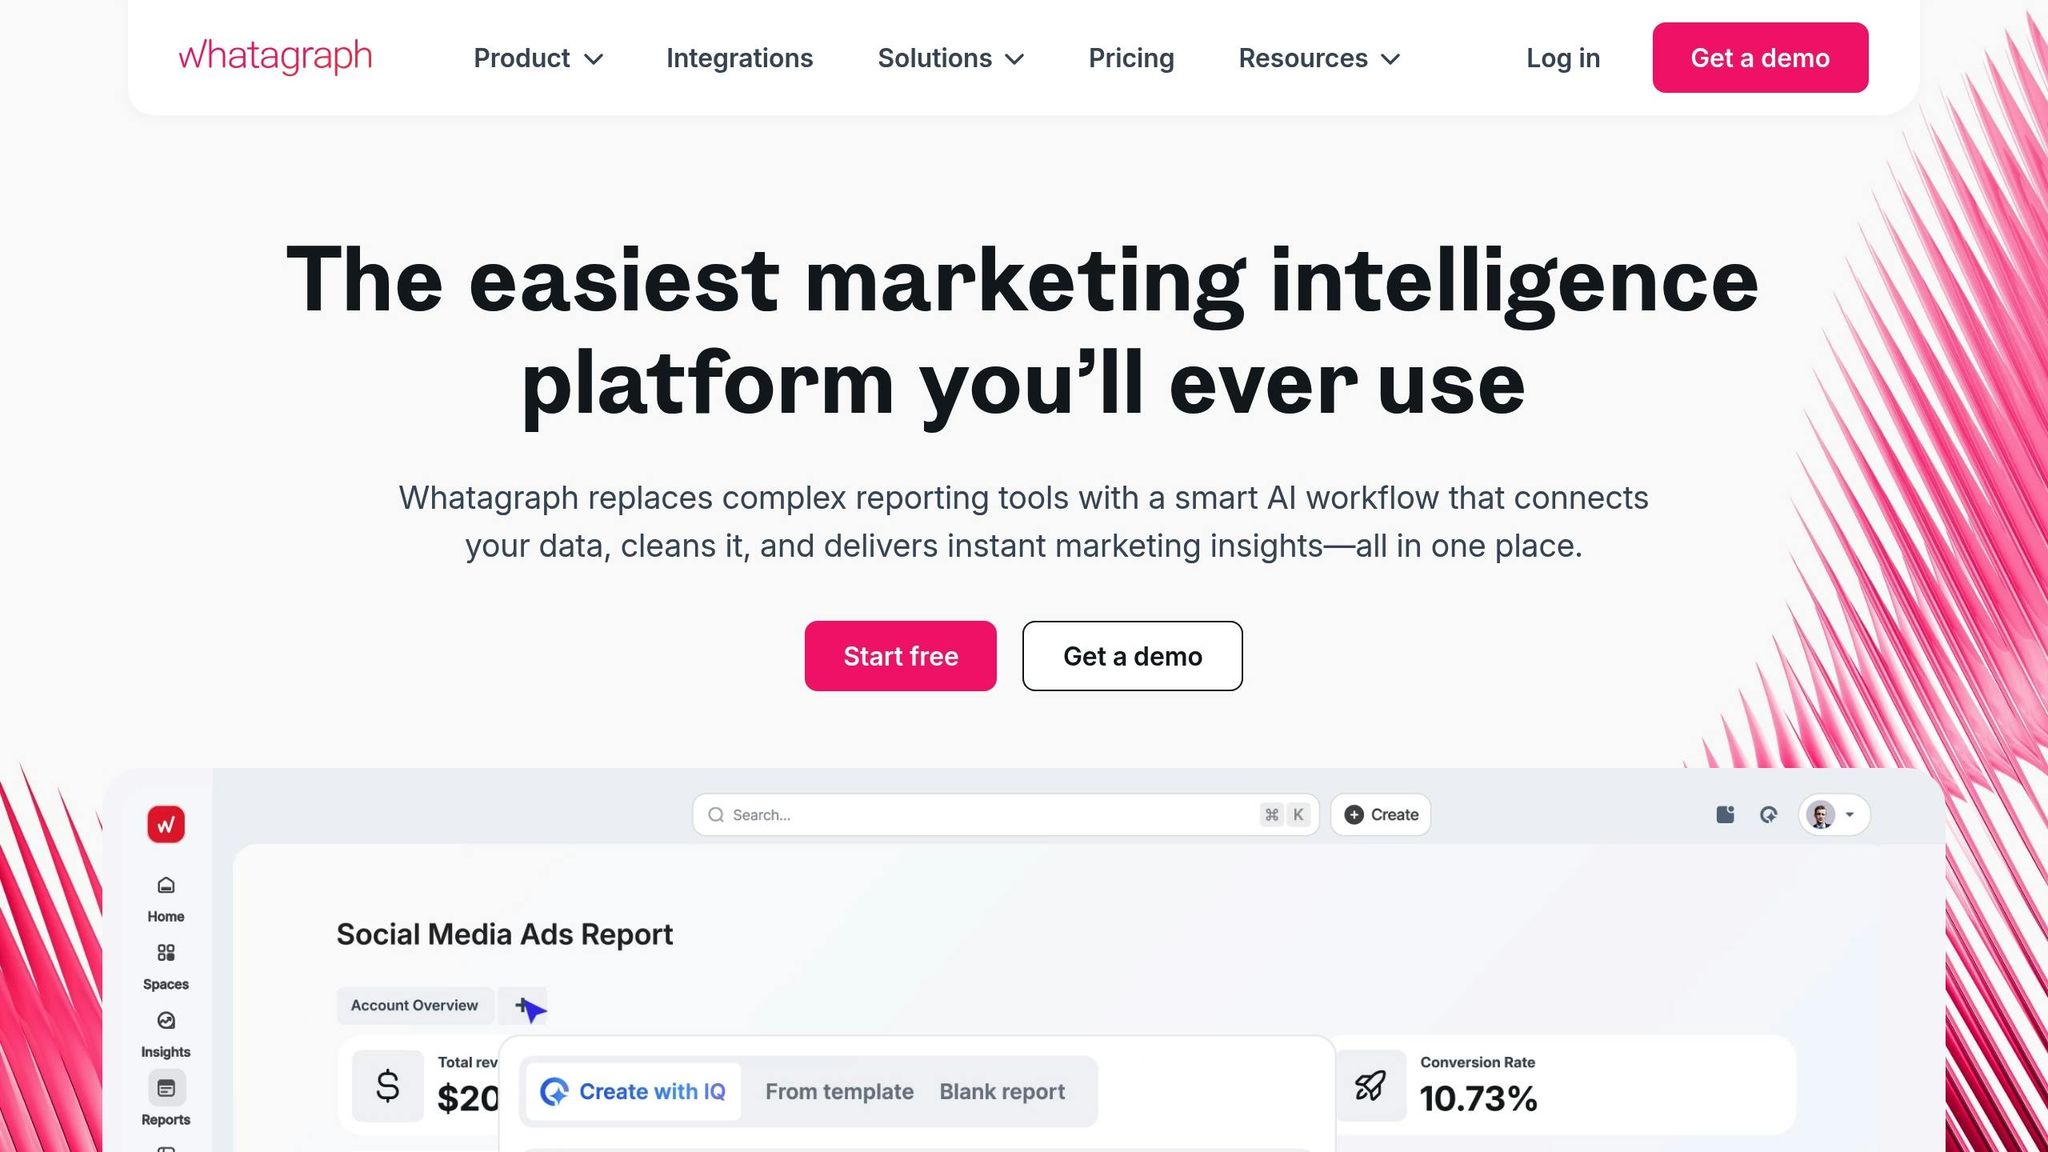
Whatagraph is tailored for agencies with teams of 10 or more. It consolidates, standardizes, and reports marketing data from multiple sources into a single, easy-to-use system. With over 55 native integrations and support for APIs, Google Sheets, and BigQuery, it’s built for flexibility. The drag-and-drop widget builder makes creating dashboards and reports a breeze, even for those without technical expertise. You can also set up custom metrics and dimensions to track what matters most to your business. An AI chatbot delivers concise KPI summaries, cutting through the noise, while the built-in currency conversion tool is a lifesaver for agencies managing international clients. Plus, with white-labeling options, agencies can maintain their branding across all client-facing reports. Automated email updates and live dashboard links make client communication effortless.
AgencyAnalytics
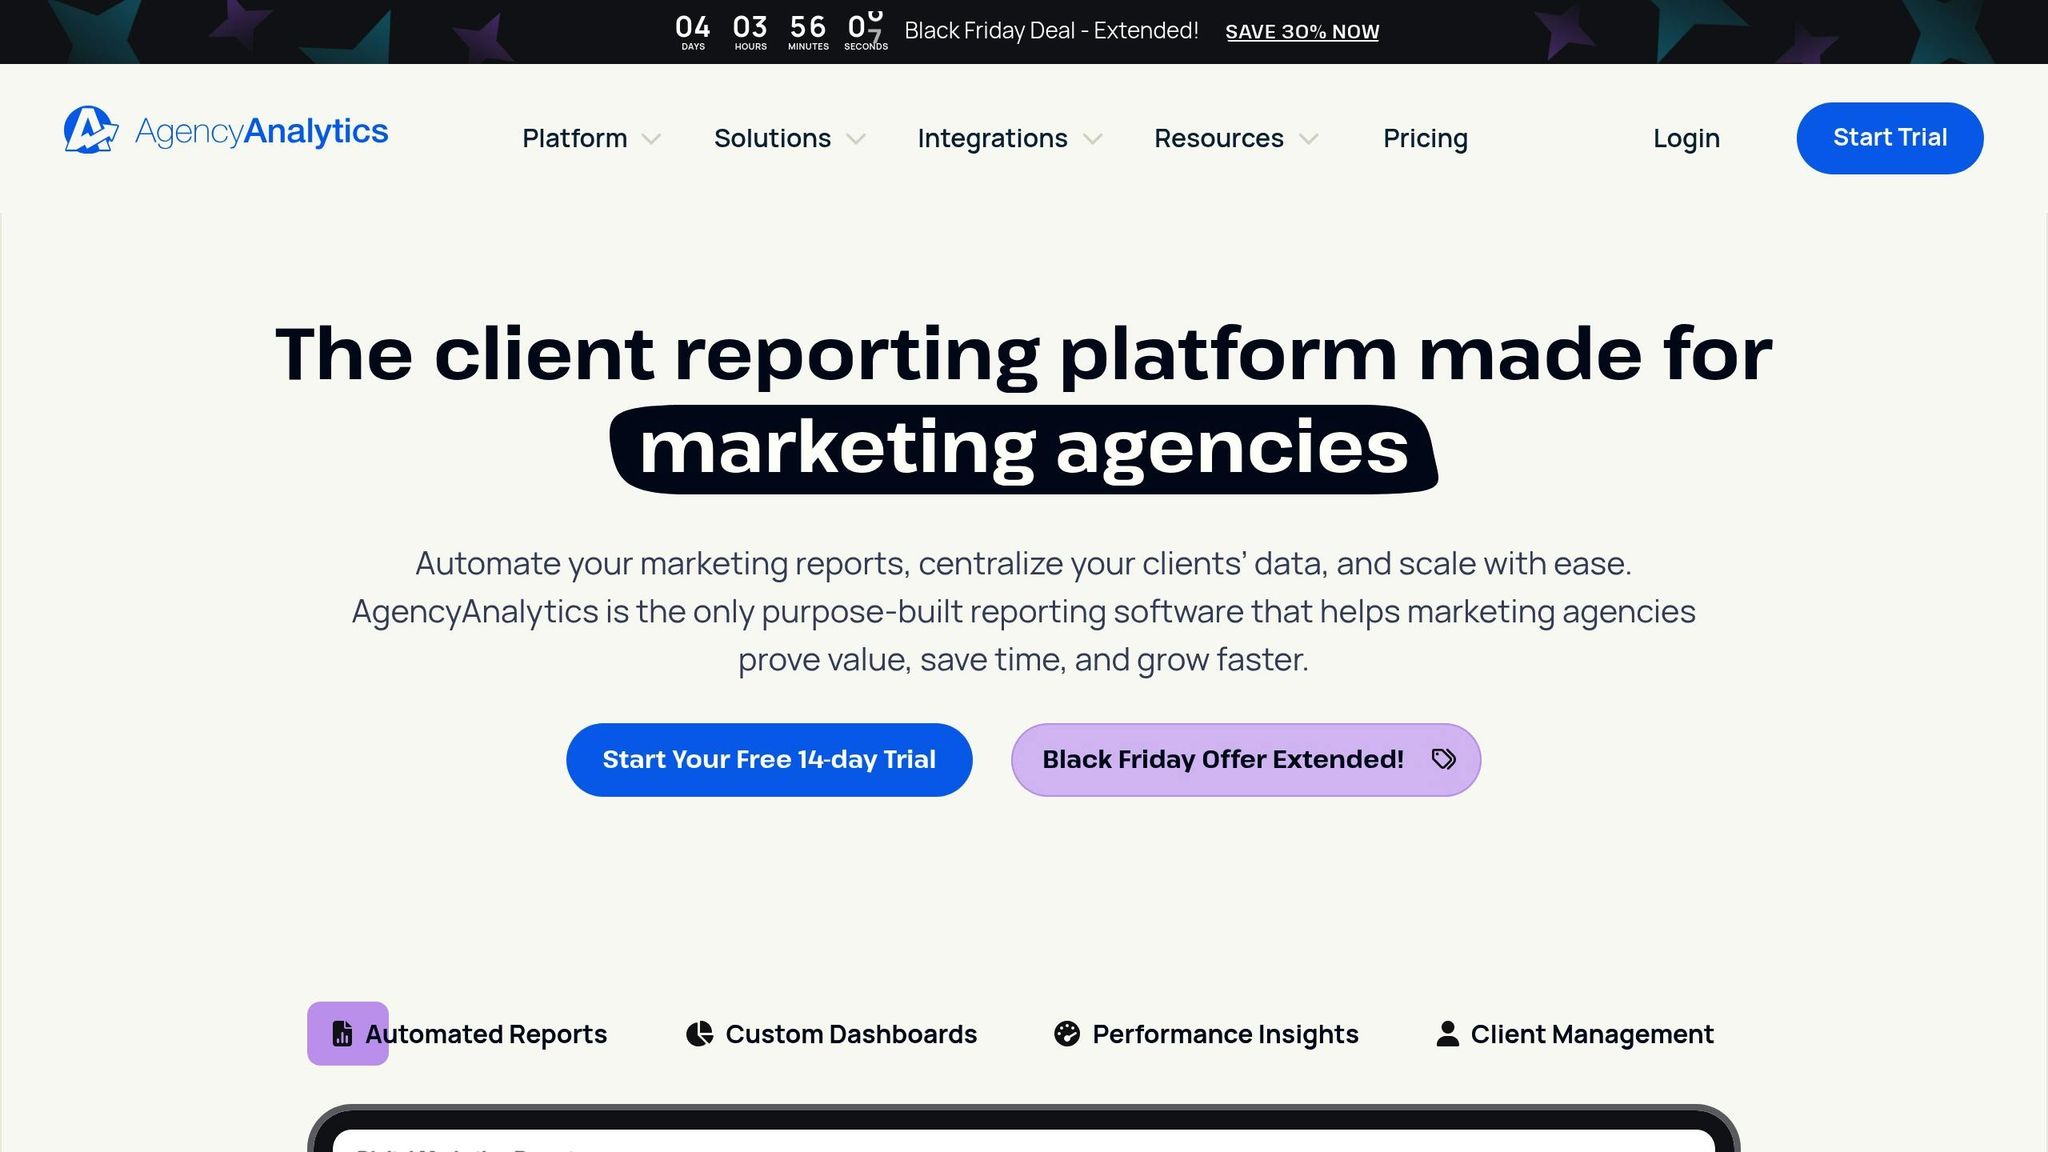
AgencyAnalytics simplifies client reporting by pulling data from more than 80 marketing integrations, saving teams from time-consuming manual work. Its Ask AI feature allows users to interact with dashboards using plain language, making it accessible for everyone – even those without a data background. The platform also includes drag-and-drop tools and ready-to-use templates that can be cloned for new clients, ensuring consistency across reports. White-label reporting and collaborative tools further enhance the professional experience for both teams and clients.
Klipfolio
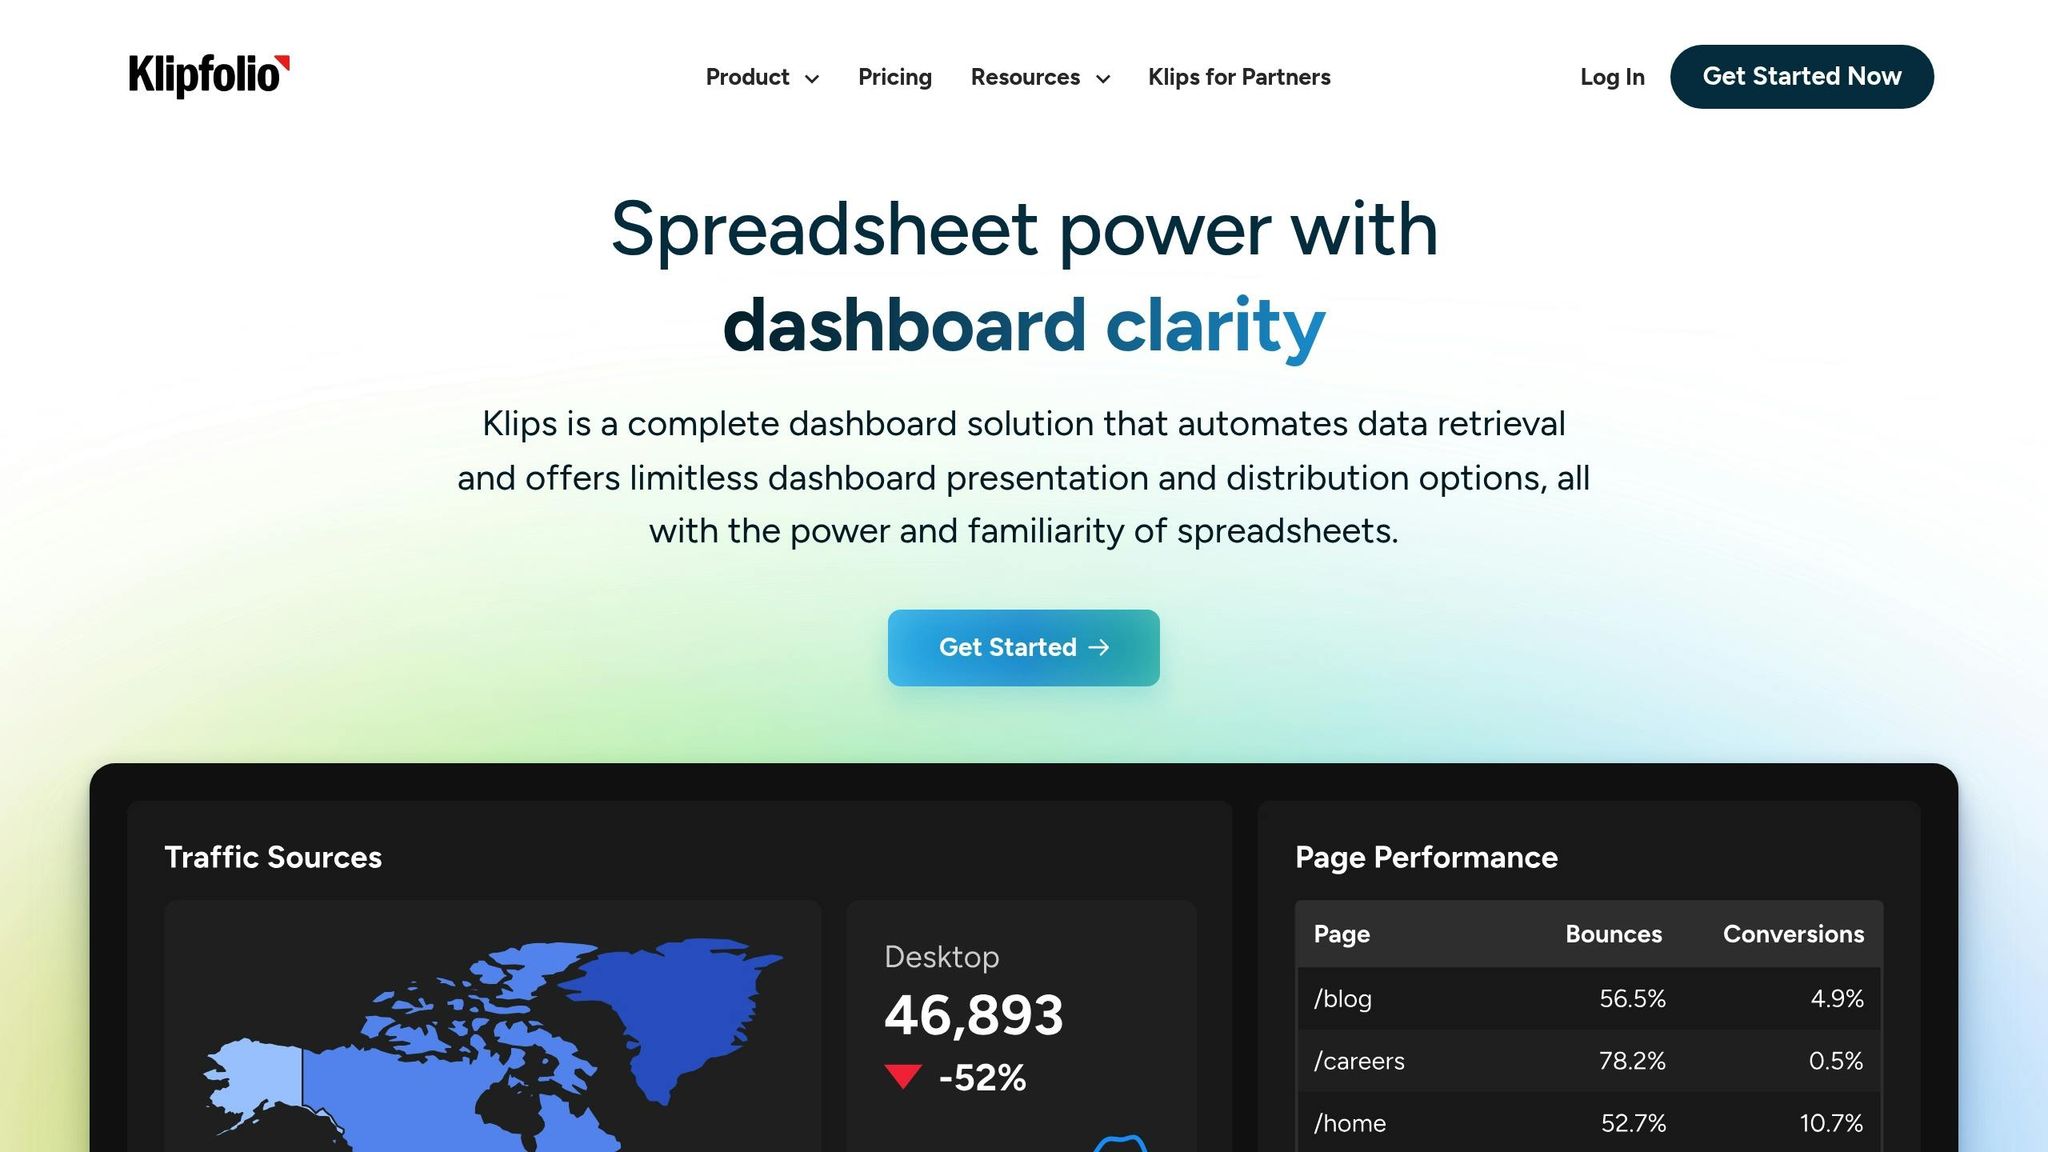
Klipfolio offers a dual solution: PowerMetrics and Klips. PowerMetrics focuses on large organizations, centralizing and standardizing certified metrics to ensure consistency across teams. Klips, on the other hand, provide dynamic data visualizations and reports, integrating with over 130 platforms, including SQL databases and data warehouses. AI-powered data blending and custom metrics help identify trends, while exporting dashboards as PDFs or images makes sharing insights straightforward.
Databox
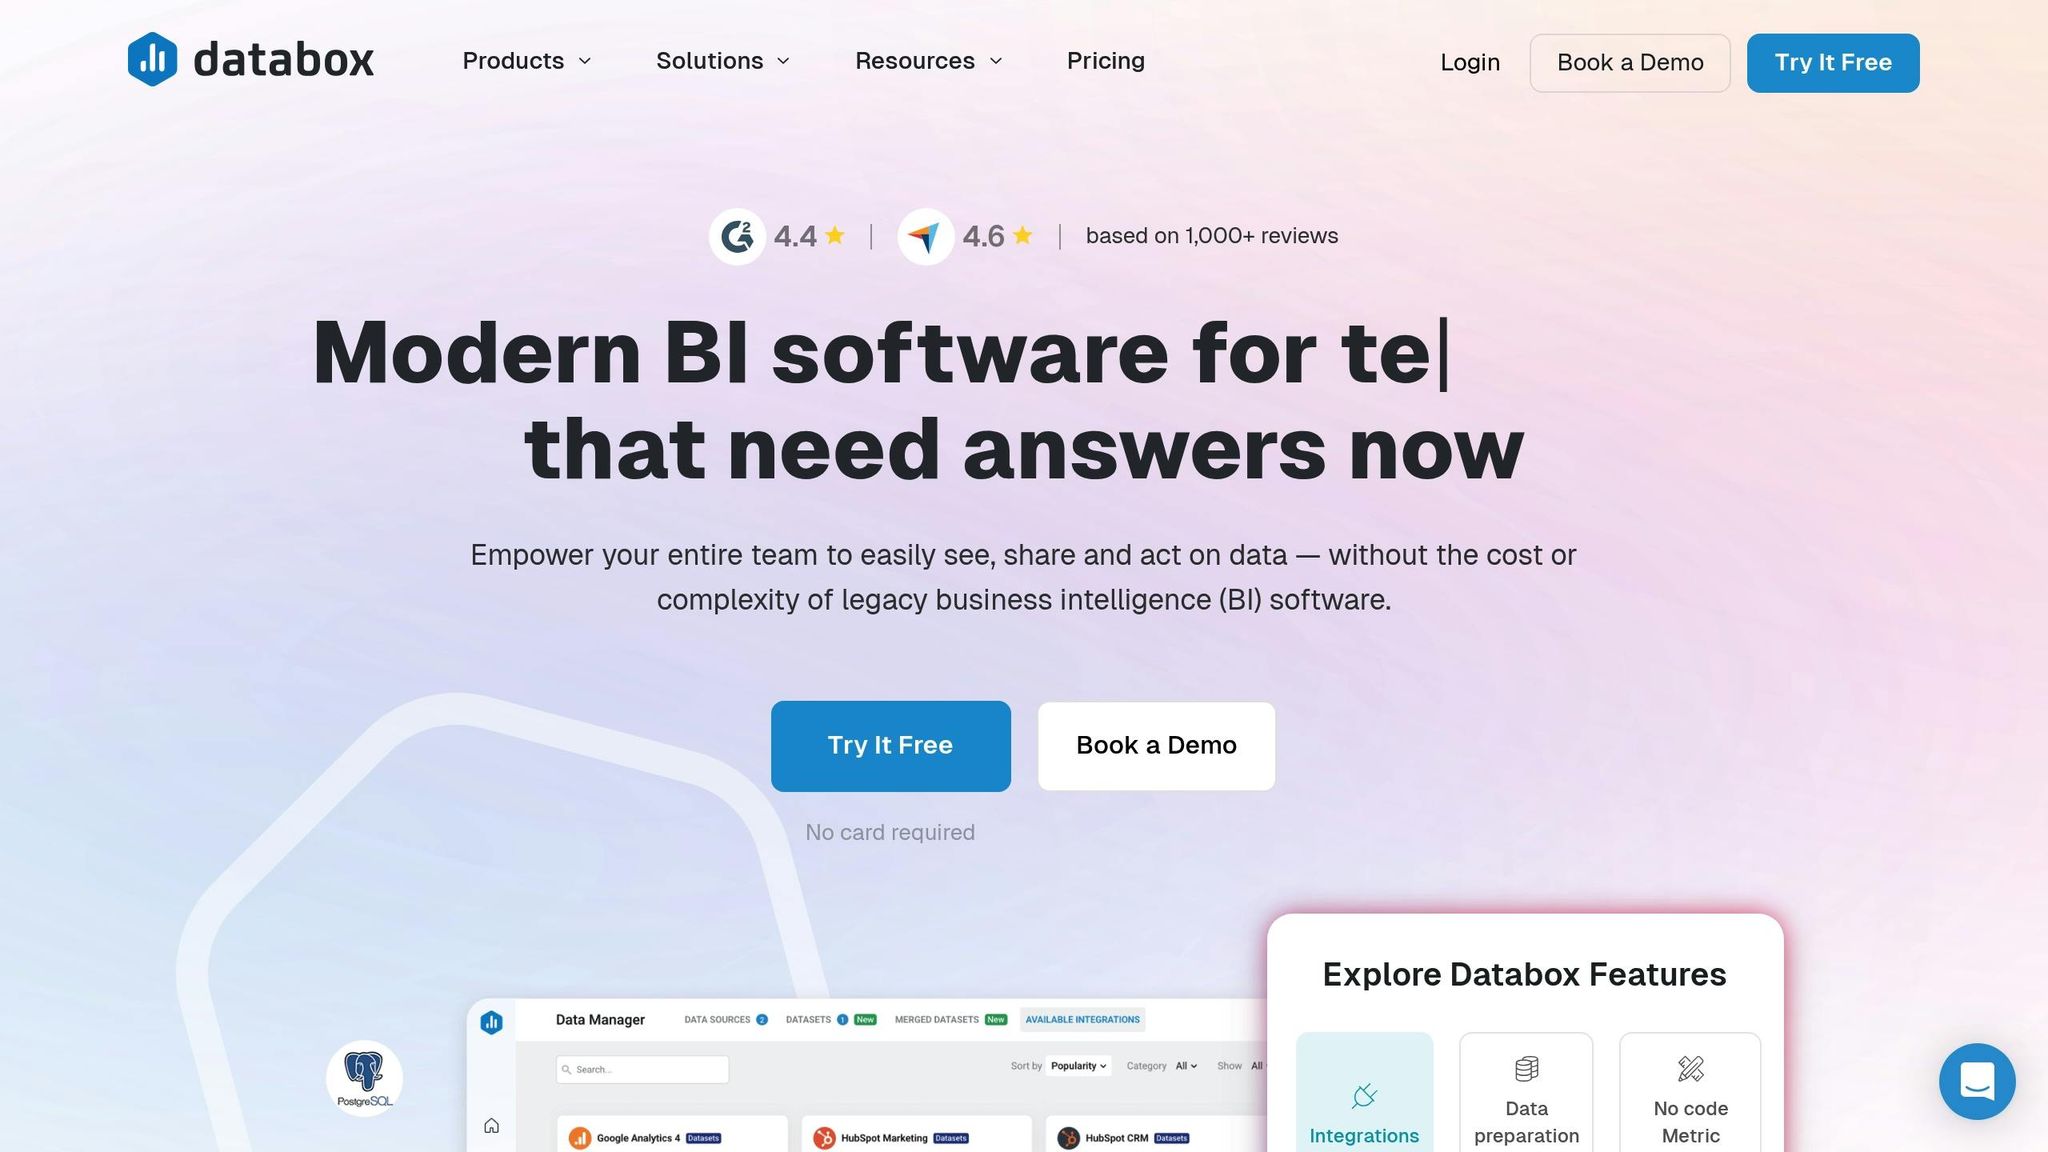
Databox is perfect for agencies and teams that need to monitor performance while staying compliant with security standards. It offers a clear view of performance across various accounts, helping users quickly spot and address issues. Customizable dashboards and automated reporting features save time, allowing teams to focus on strategy. Its strong emphasis on data security ensures compliance with privacy regulations – essential for handling sensitive client data.
NinjaCat
NinjaCat stands out with its modular structure, offering flexibility for agencies of all sizes. Its key modules include:
- TapData: Facilitates data movement and custom blending.
- TapReports: Enables the creation of custom dashboards and automates reporting.
- TapAnalytics: Provides interactive analytics to uncover trends.
- TapInsights: Delivers AI-driven recommendations, executive summaries, and configurable alerts.
Pricing starts at $99 per month for TapDataLite (with 64 connectors) and scales up to $649 per month for TapData Max (offering 250+ connectors and API access). Additional modules – like TapReports ($199/month), TapAnalytics ($899/month), and TapInsights ($1,399/month) – allow agencies to expand their capabilities as needed.
TapClicks
TapClicks offers a wide range of built-in connectors, along with a smart connector for hassle-free data extraction. It supports advanced data calculations and includes a Data Exporter, making it easy to send information to tools like BigQuery, Looker Studio, or other databases. Interactive dashboards combined with AI-driven insights help teams analyze key metrics and trends in depth. Automated reporting ensures stakeholders stay informed without requiring extra manual effort.
These platforms demonstrate how AI can take data visualization and marketing analytics to the next level, making it easier to turn raw data into actionable insights.
Comparison of Key Features Across Platforms
Comparison Table
| Platform | Native Integrations | AI Features | Export Options | Target Market | White-Label | Starting Price |
|---|---|---|---|---|---|---|
| Whatagraph | 55+ | AI chatbot, AI summaries | Excel, CSV, BigQuery, Looker Studio | Medium to large agencies (10+) | Yes | Not specified |
| AgencyAnalytics | 80+ | Ask AI, AI-driven dashboards | Multiple formats | Agencies | Yes | Not specified |
| Klipfolio | 130+ | AI insights | PDF, images, CSV (individual clips) | Startups | Not specified | Not specified |
| Databox | Not detailed | AI insights | Not detailed | Teams focused on compliance | Not specified | Not specified |
| NinjaCat | Not detailed | Not detailed | Not detailed | Not detailed | Not detailed | Not detailed |
| TapClicks | Wide variety | TapInsights, TapAnalytics | Data Exporter to warehouses and databases | Agencies | Yes | $99/month |
This table breaks down the main features of each platform, making it easier to compare their strengths in integrations, AI tools, export options, and target audiences.
For integrations, Klipfolio leads the pack with over 130 options, while AgencyAnalytics supports 80+ platforms, and Whatagraph offers 55+ integrations with API support. On the AI front, AgencyAnalytics features "Ask AI" for simplified insights, and Whatagraph includes an AI chatbot for quick KPI summaries. TapClicks takes it a step further with its TapInsights module, offering executive summaries, alerts, and benchmark widgets.
When it comes to data exports, Whatagraph enables no-code exports to BigQuery and Looker Studio, while TapClicks facilitates data flow with its Data Exporter tool. Klipfolio provides flexible options like PDFs, images, and CSV files for individual clips.
Pricing varies across platforms. TapClicks starts at $99 per month, while others like Whatagraph, AgencyAnalytics, and Klipfolio offer custom quotes. White-label branding is available on Whatagraph, AgencyAnalytics, and TapClicks, making them appealing for agencies. Meanwhile, Whatagraph caters to medium-to-large agencies, Klipfolio targets startups, and Databox is designed for compliance-driven teams.
Each platform offers unique strengths. Whatagraph focuses on multi-source data standardization with customizable metrics, while AgencyAnalytics uses a pre-built marketing data model for cross-channel insights. TapClicks stands out with tools for custom data blends and advanced reporting. Additionally, Whatagraph supports automated report sharing via email and live dashboards, and AgencyAnalytics enhances collaboration with user roles and automated reporting pipelines.
This overview provides a snapshot of each platform’s key features, helping you identify the right fit based on your integration and AI needs.
sbb-itb-d6d4d8b
How to Select the Right AI-Powered Dashboard
Choosing the right AI-powered dashboard isn’t just about ticking feature boxes – it’s about aligning the platform’s capabilities with your business goals. A well-suited dashboard can streamline operations, deliver actionable insights, and reduce manual effort. On the flip side, the wrong choice can lead to wasted resources, frustrated teams, and delayed decision-making.
Evaluate Integration Needs
Start by reviewing your current marketing tech stack and mapping out all the data sources you rely on, such as ad platforms, CRMs, email tools, and social media channels. Don’t forget to factor in any additional tools you plan to adopt in the next year or two. Platforms like Whatagraph (with over 55 integrations, plus options for custom API, Google Sheets, or BigQuery), Klipfolio (offering 130+ connections, including SQL databases and data warehouses), TapClicks (featuring built-in and smart connectors), and AgencyAnalytics (with ready-made integration templates) are designed to simplify implementation and support future growth.
Assess AI Capabilities
Not all AI features are created equal, and their usefulness often depends on your team’s analytical expertise and reporting needs. For instance, natural language query interfaces can help non-technical users get quick answers, while AI-generated summaries save time for executives by distilling complex data into digestible insights.
Here are some examples:
- Whatagraph includes an AI chatbot that simplifies KPI analysis.
- AgencyAnalytics offers an "Ask AI" tool for natural language interaction with dashboard sections.
- TapClicks provides TapInsights, which delivers executive summaries, alerts, and benchmark widgets.
Additionally, look for features like forecasting models, trend analysis, and anomaly detection to make your dashboard a proactive planning tool. Use trial periods to test these capabilities and ensure they align with your needs.
Consider Customization and Scalability
Once you’ve reviewed integrations and AI features, think about how the platform will grow with your business. Check if it supports role-based access controls to manage permissions as your team expands. Many platforms also offer white-label reporting and customizable dashboards, which can save time and improve client onboarding with template cloning.
Scalability is another key factor. Ensure the platform can handle increasing data volumes and maintain fast processing speeds. For instance:
- Whatagraph is tailored for medium to large marketing agencies with 10+ employees.
- Klipfolio’s PowerMetrics centralizes and standardizes metrics, making it ideal for larger enterprises.
Pricing models play a role in long-term planning too. TapClicks, for example, offers tiered pricing: TapDataLite at $99/month, TapData+ at $349/month, and TapData Max at $649/month, allowing businesses to scale costs as they grow.
Finally, don’t overlook data governance and security. If you’re working with sensitive customer information, make sure the platform complies with regulations like GDPR and CCPA. Features such as audit logs, no-code data transfers to your preferred data warehouse, and robust privacy measures are essential. Also, consider the platform’s usability – drag-and-drop interfaces, pre-built templates, and strong customer support can significantly reduce the learning curve and speed up implementation. Trial periods are invaluable for assessing whether the platform aligns with your team’s workflow.
Emerging Trends in AI Marketing Analytics
The world of marketing analytics is transforming at a breakneck pace. Thanks to advancements in AI and machine learning, marketers now have access to insights that were previously unimaginable. These tools are no longer just about analyzing past campaign results – they’re reshaping the process into a forward-looking system that predicts outcomes and suggests optimizations before issues arise. This shift is paving the way for even more sophisticated tools that change how marketers use data.
One game-changer is natural language processing (NLP), which is making data more accessible across marketing teams. With conversational interfaces, marketers can now pull insights without needing to know SQL or have a background in data science. Dashboards are evolving from static visual displays to interactive tools that offer real-time intelligence.
The rise of predictive analytics is another major trend. AI now helps forecast customer behavior, segment audiences, and even recommend personalized content. Instead of waiting to see which customer groups convert, predictive models identify the most promising prospects and suggest immediate actions. For example, TapClicks’ TapInsights module identifies market trends and opportunities, helping teams make smarter decisions based on data.
Real-time trend detection is also revolutionizing campaign performance monitoring. AI-powered dashboards, like those in Facebook Ads, track key metrics such as CPC and ROAS in real time. This means marketers can catch issues like ad fatigue or spot scaling opportunities as they happen, rather than during a weekly review. Platforms like TapInsights further enhance this by offering customizable alerts and benchmarks, notifying teams when campaigns deviate from expectations. This shift turns marketing into a continuous optimization process.
Attribution modeling is becoming far more precise with AI integration. Tools like AgencyAnalytics use AI to better quantify the impact of individual channels on conversions. For example, marketplace sellers can now determine whether their growth stems from organic rankings or paid campaigns – and whether ad spend is cutting into organic sales. Machine learning models weigh each touchpoint’s influence, helping marketers allocate budgets wisely and measure ROI more accurately.
The automation of data integration and standardization is also picking up speed. Platforms like Whatagraph excel at connecting and standardizing data from multiple sources, ensuring consistency and accuracy across metrics and formats. This automation enables marketers to analyze large-scale data without worrying about inconsistencies.
Competitive benchmarking is taking a leap forward as well. AI-powered tools like TapInsights allow marketers to compare their performance against industry averages using benchmark widgets. This contextual analysis helps teams understand whether their metrics are strong or need improvement. For instance, a ROAS of 3:1 might be stellar in one industry but subpar in another, and these benchmarks provide the context needed for smarter decision-making.
Perhaps one of the most exciting developments is how AI is leveling the playing field for smaller teams. No-code platforms with pre-built templates and AI-driven insights enable small agencies to deliver analytics on par with much larger competitors. This accessibility means even teams without dedicated data scientists can implement advanced strategies.
Stricter data privacy regulations are also shaping the landscape. Role-based access controls and no-code integrations with secure data warehouses like BigQuery are becoming standard. These features ensure data security while still allowing organizations to harness the power of AI-driven insights.
AI-powered dashboards are no longer just about looking back at what happened – they’re becoming tools that predict, recommend, and empower. The platforms that seamlessly combine these capabilities with secure, user-friendly interfaces are setting the standard for the next wave of marketing analytics. Teams of all sizes now have the tools to make smarter, faster decisions with confidence.
Conclusion
AI dashboards are transforming how marketing teams uncover insights. By consolidating data and offering instant analytics, these tools save countless hours of manual reporting. That extra time can be redirected toward more impactful work, strengthening client relationships, and driving profitability.
But it’s not just about saving time – accuracy matters. AI ensures consistent data, flags anomalies, and reveals patterns, giving you the confidence to make informed decisions. Reliable data helps you avoid costly mistakes and stay on track.
Predictive analytics powered by AI go a step further, identifying trends and opportunities as they emerge. This allows you to fine-tune campaigns quickly – scaling up successful ones or pivoting away from those that aren’t performing. Real-time insights give you the edge to act faster, and over time, that advantage builds into a stronger competitive position.
Each platform discussed in this guide has its own strengths. Some are great for integrating with a wide range of tools, others shine in customization, and some stand out for their advanced AI capabilities. Choosing the right one depends on your needs – what data sources you rely on, your team’s technical expertise, whether you require white-label reporting, and your budget. Matching these features to your goals is key to finding the best fit.
Start by exploring demos and testing platforms with your actual data. Look for tools that excel in integration, AI functionality, and customization, as these are critical for long-term success. Many vendors offer trial periods, giving you a chance to see how well a platform aligns with your workflows before making a commitment. Prioritize solutions that connect marketing metrics directly to business outcomes like revenue and ROI, rather than focusing on surface-level metrics. Platforms that combine powerful AI tools with user-friendly interfaces will deliver the most value.
As marketing grows more complex, AI dashboards simplify the process, bringing enterprise-level analytics to teams of all sizes. Whether you’re part of a small agency or a large corporation, these tools provide access to insights that were once out of reach. By adopting AI-driven analytics, you can navigate the evolving marketing landscape with confidence and choose a platform that drives your strategic goals forward.
FAQs
How can AI-powered dashboards help improve marketing analytics decisions?
AI-driven dashboards simplify marketing analytics by pulling together data from various sources into one clear, user-friendly display. Using advanced algorithms, these tools highlight trends, uncover patterns, and deliver actionable insights, enabling marketers to make quicker and smarter decisions.
They also offer real-time updates and visualizations, making it easier for teams to track performance, tweak strategies, and fine-tune campaigns with accuracy. By cutting down on the time spent on manual data analysis, these dashboards allow marketers to concentrate on strategic planning and innovative problem-solving.
What should marketing teams look for when choosing an AI-powered dashboard?
When choosing an AI-powered dashboard for your marketing team, there are a few things to keep in mind to ensure it fits your needs. Start with ease of integration – you’ll want a platform that connects smoothly with tools you already use, like CRM systems, ad platforms, or analytics software. This saves time and avoids unnecessary headaches.
Next, look for customization options. Being able to tweak the dashboard to focus on the metrics that matter most to your team is a game-changer. A dashboard that feels tailored to your goals will always be more effective.
Don’t overlook the importance of a user-friendly interface. Even the most powerful tool is useless if your team struggles to navigate it. And if the platform offers AI-driven insights – like predictive analytics or automated recommendations – that’s a big plus. These features can help your team act on data quickly and confidently.
Lastly, consider scalability and pricing. Make sure the platform not only fits your current budget but can also grow with your team’s needs over time. Balancing cost with long-term value is key.
How does natural language processing (NLP) make AI-powered marketing dashboards more user-friendly?
Natural language processing (NLP) takes AI-powered marketing dashboards to the next level by enabling users to interact with them using simple, conversational language. Instead of wrestling with complicated menus or trying to decode raw data, users can ask straightforward questions like "What were our top-performing campaigns last month?" or "Show me sales trends for Q3." and get instant, easy-to-understand insights.
This feature not only streamlines data analysis but also saves time and opens the door for non-technical users to leverage advanced analytics. By translating raw data into human-friendly insights, NLP allows marketers to spend their energy on strategy and decision-making rather than struggling to interpret complex data.
Related Blog Posts
- 7 AI Marketing Tools That Boost ROI in 2025
- 5 Ways AI Segmentation Improves Marketing Automation
- AI in Omnichannel Campaigns: Benefits and Challenges
- How to Simplify Marketing Data Without Losing Accuracy